Bridging data gaps
There are currently major gaps in the available data about care across the UK. To address this, we are focused on making care data more comprehensive and accessible and this page offers a few examples of how we do this.
We are building new tools and platforms based on Open Science principles – meaning we share our work openly. For example, we publish the data “recipes” (called metadata and replication files) for many of our studies on our GitHub page. Our Care Data Infrastructure team collaborates with colleagues across the Centre, and with the ONS, to improve analytical capacity in care research; this work has consolidated our ‘Valuing Carers’ series. The team is also working on the development of a national Survey of Carers with government departments and the ONS.
Case studies
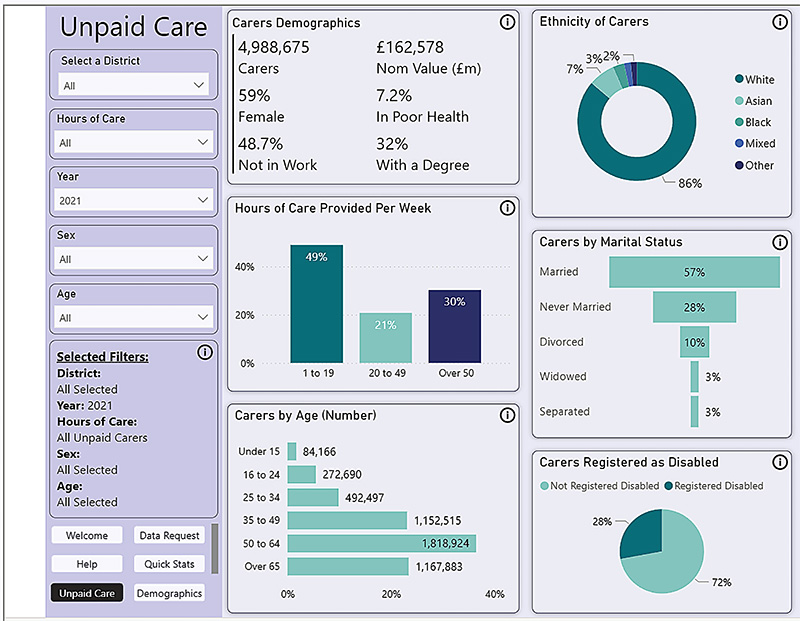
The Unpaid Care Dashboard, a co-created tool to unlock data and ignite change
Unpaid carers provide care for family members, friends, and neighbours in need of support due to long-term illness, disability or older age.
The Unpaid Care Dashboard is an interactive tool bringing together data from the 2011 and 2021 England and Wales Censuses, building on findings from our report, Valuing Care 2021: England and Wales. It allows users to explore data and create graphs and reports, enabling them to:
- see which groups of people are providing unpaid care within local authorities, and compare this with other places in England and Wales
- see how unpaid carers as a group have changed over time – for example, how much care they provide, whether their health is better or worse, and which types of jobs they do
- combine data for multiple local authorities that make up different geographical or administrative areas such as an Integrated Care Board
- understand how resources or services might be changed to support local populations, and to support the development of business cases.
Co-creating the Unpaid Care Dashboard
We worked in partnership with Carers UK, the South Yorkshire Integrated Care Board, people with lived experience of care, and the ONS to co-create the dashboard. We held co-design workshops, bringing together service providers, commissioners, unpaid carers organisations and people with lived experience of care and support. This approach ensured the dashboard addressed everyone’s expectations, priorities and goals. The dashboard is also screen reader compatible to increase accessibility.
Our aim was to develop a freely accessible, inclusive and interactive resource that anyone could use to understand and explore unpaid care. This includes a wide range of people from different backgrounds and with diverse abilities, including the general public, unpaid carers, and people with responsibilities for social care services.
The dashboard has reached numerous local authorities and unpaid carer support providers and has allowed them to access key data on unpaid carers in ways that are easy to analyse and interpret, allowing services to adjust and tailor support to the needs of their community.
Making ONS data available to the public
To develop the dashboard, we commissioned new data tables on unpaid care from the ONS. These were previously not available to the general public. They include breakdowns of unpaid care provision by age, sex, long-term health problem or disability, highest level of qualification, ethnic group, economic activity, general health, employment history, religion, industry of employment, and marital status.
Making research easier to understand
When researchers analyse data, they often need to make many small, subjective decisions such as which factors to include or how to represent relationships. These choices can significantly change the outcome of the study. RobustiPy, a new, free software tool we have co-developed with the Leverhulme Centre for Demographic Science, helps researchers see how their choices affect their study results while building their models. RobustiPy users can rapidly test thousands or even millions of different model setups. It has built-in features that help with bootstrapping, model selection, out-of-sample validation and variable importance. Researchers can make their work more transparent, reliable, and easier to understand by using the tool. It helps ensure that the conclusions drawn from a study are solid and don’t depend on one specific set of choices.